
Results
In a PCR reaction, DNA is isolated and used in a reaction with primers, polymerase, buffers, and a heat source in order to amplify and replicate DNA many times over. For our experiment, we performed a PCR reaction on DNA from our cheek cells and were able to obtain a result from the gel electrophoresis. Our electrophoresis produced bright bands of DNA strands (Figure 2). In gel electrophoresis, if the bands are bright it means that there is a large amount of DNA. This means that the PCR reaction had a strong yield of DNA. All of the DNA we put through the electrophoresis traveled 400 nanometers, indicating that we obtained a PCR product in the expected size range.
After the PCR reaction and DNA gel electrophoresis the DNA genotypes were identified for each individual at the 52, 54, and 71 positions. At the 52 and 54 positions the possible genotype combinations were “cc”, “ct”, or “tt” while at the 71 position the possible combinations were “aa”, “ac”, or “cc”. In his experiment, Hamer identified having a “c” nucleotide base rather than an “a” as indication that an individual is more spiritual.
From our experimental dataset, we converted all of the genotype frequencies into percentages and compared them to the general population genotypes in a chi-square test. We calculated a p-value of .15. Due to this statistic, we failed to reject our null hypothesis. Therefore, we can conclude that there is no significant difference our experimental population and the general population when it comes to heightened spirituality.
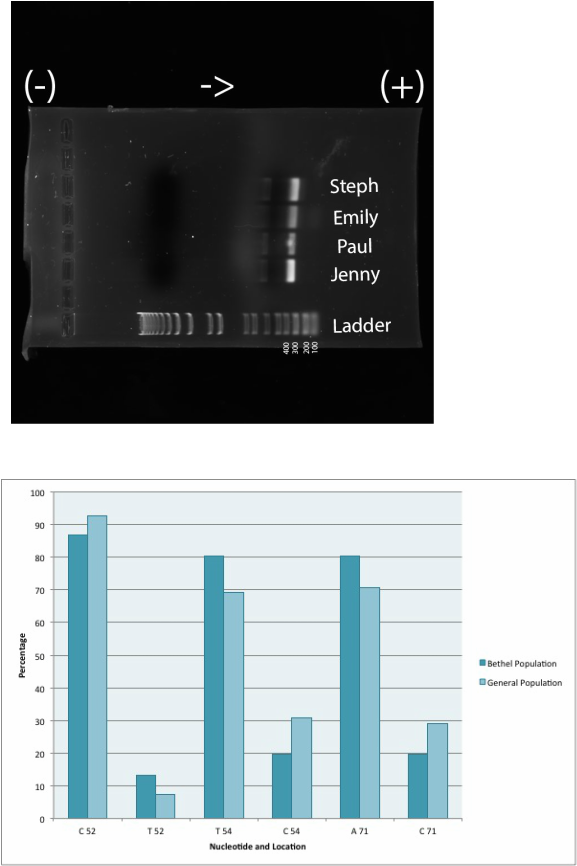
Figure 2. Photo of agarose gel after electrophoresis. The bright bands in the gel show the presence of DNA. When the electrical current is put through the agarose gel, the DNA travels from the negative end to the positive end, left to right in this image. The top four bands are the DNA samples from the four group members. The bottom row of bands is a reference sample of DNA used to determine the length of our DNA strands. The distance traveled is directly related to the length of the DNA fragments. In this photo, it is shown that our DNA samples are in the 300-400 base pair length range.
Figure 3. Average of presence of specific nucleotides in the Bethel community compared to the general population. The presence of a C nucleotide at the 52, 54, and 71 positions in DNA is the indicator for the presence of the God Gene. In comparison to the general population, the Bethel population has a lower percentage of the C nucleotide in all three positions. These results yielded a p-value of 0.15, which indicates that there is not a significant difference between these two populations.
After the PCR reaction and DNA gel electrophoresis the DNA genotypes were identified for each individual at the 52, 54, and 71 positions. At the 52 and 54 positions the possible genotype combinations were “cc”, “ct”, or “tt” while at the 71 position the possible combinations were “aa”, “ac”, or “cc”. In his experiment, Hamer identified having a “c” nucleotide base rather than an “a” as indication that an individual is more spiritual.
From our experimental dataset, we converted all of the genotype frequencies into percentages and compared them to the general population genotypes in a chi-square test. We calculated a p-value of .15. Due to this statistic, we failed to reject our null hypothesis. Therefore, we can conclude that there is no significant difference our experimental population and the general population when it comes to heightened spirituality.
Figure 2. Photo of agarose gel after electrophoresis. The bright bands in the gel show the presence of DNA. When the electrical current is put through the agarose gel, the DNA travels from the negative end to the positive end, left to right in this image. The top four bands are the DNA samples from the four group members. The bottom row of bands is a reference sample of DNA used to determine the length of our DNA strands. The distance traveled is directly related to the length of the DNA fragments. In this photo, it is shown that our DNA samples are in the 300-400 base pair length range.
Figure 3. Average of presence of specific nucleotides in the Bethel community compared to the general population. The presence of a C nucleotide at the 52, 54, and 71 positions in DNA is the indicator for the presence of the God Gene. In comparison to the general population, the Bethel population has a lower percentage of the C nucleotide in all three positions. These results yielded a p-value of 0.15, which indicates that there is not a significant difference between these two populations.
